
Looking to learn how to turn any youtube video into an infographic online free? Long YouTube tutorials are useful, but sitting through an hour-long explanation just to extract a few important details can be exhausting. Many of us keep adding videos to a “Watch Later” list that only grows longer. A new workflow shared on Reddit offers a practical way out: convert the entire video into a clear infographic in about sixty seconds using Gemini’s multimodal abilities.
This method doesn’t require design skills, editing experience, or specialized tools. It’s a simple two-prompt system that gives you a clean, high-value summary you can use for study, projects, presentations, or quick reference.
At TechVitara, we tested, fact-checked, and expanded that idea into a user-centric how-to you can use today. In this blog, you will learn about how to turn any youtube video into an infographic online free, its tech background, pitfalls, and best practices for students and pros who want to save time and remember more.
TL;DR — What this does and why it matters
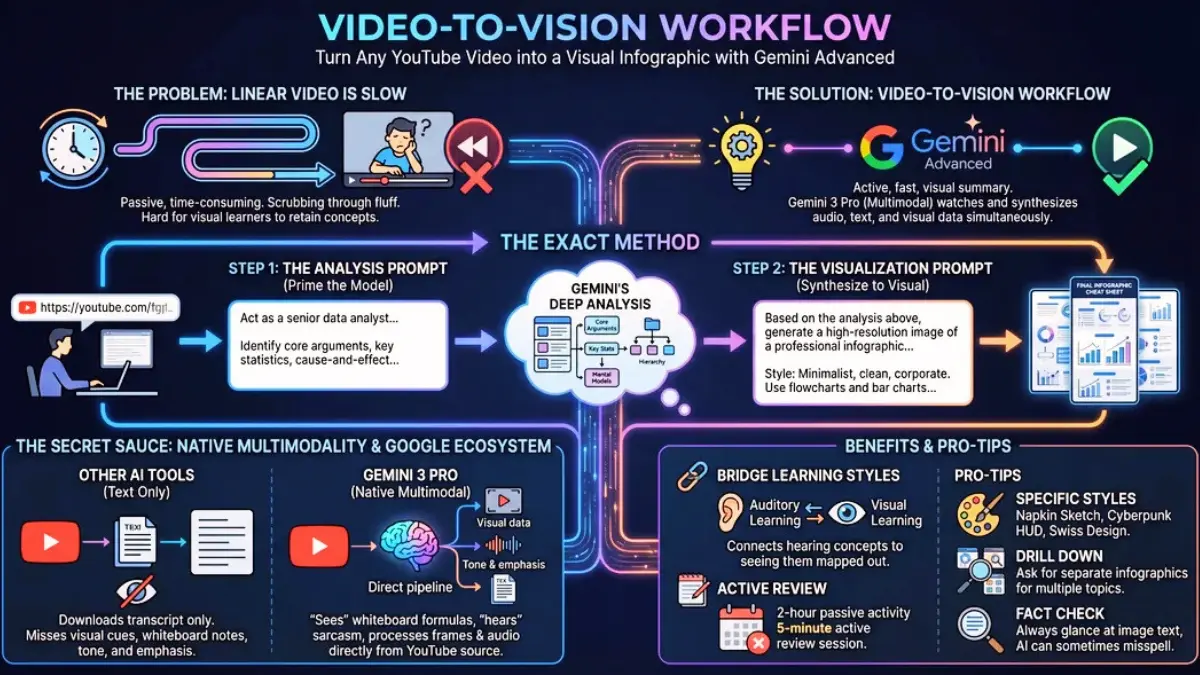
- Paste a YouTube link into Gemini (the Reddit workflow suggests Gemini Advanced / Gemini 3 Pro), ask the model to analyze the video deeply, then ask it to generate a high-resolution infographic from that analysis.
- The result: a shareable visual cheat-sheet that captures core arguments, timelines, stats, and mental models.
- Why it works now: Gemini 3 Pro is designed for large-context multimodal understanding. It can process audio, video frames and on-screen text together, which helps it capture visual details that transcript-only approaches miss.
Why People Are Switching an YouTube Video to Infographic Summaries?
Most learning on YouTube is slow because you’re forced to follow the creator’s pace. Even useful videos for “How to turn any youtube video into an infographic online” often include long intros, sponsor placements, and unnecessary repetition. Visual learners especially struggle with audio-only explanations; they remember much better when information is organized into diagrams, flowcharts, and quick-reference boxes.
Infographics solve that problem. Instead of rewatching a tutorial multiple times, you get a single page that lays out the main ideas, cause-and-effect links, statistics, and core insights.
Gemini’s video capabilities allow it to extract all of this without needing you to manually scrub through the video.
The 2-Step “Video to Infographic” Workflow from TechVitara
This method for “how to turn any youtube video into an infographic online” relies on giving the AI clear instructions in two stages:
1) Extract the raw information
2) Convert that information into a high-quality infographic
Simple, but extremely effective.
Step 1: The Analysis Prompt (Extract Everything That Matters)
Most people paste a YouTube link and expect a summary. That rarely works well. You need a prompt that tells the model to behave like an analyst, not a casual summarizer.
Use this:
Prompt 1 — Deep Analysis
Act as a senior data analyst and educational content creator. Analyze the content of this YouTube video: [PASTE LINK]. Identify the core arguments, key statistics, steps, and any unique frameworks or mental models. Present the output as a clear hierarchy of information (main points → sub-points → details). Focus on cause-and-effect relationships and keep the information dense and specific. Also identify any important visuals shown in the video (charts, diagrams, on-screen text, formulas).
This gives you a complete breakdown: structure, ideas, numbers, and visuals that will later feed the infographic.
Step 2: The Visualization Prompt (Turn the Analysis Into an Infographic)
Once you have the analytical outline, ask Gemini to turn it into a structured visual.
Prompt 2 — Infographic Generation
Based on the analysis above, create a professional infographic summarizing the main concepts. Style: clean and minimalist (or “hand-drawn sketch” if preferred). Include flowcharts for processes, simple bar charts for statistics, and short callout boxes for insights. The infographic should stand on its own as a teaching aid. Output at high resolution (4K if possible).
In seconds, you receive a polished visual summary that looks similar to something a designer would create.
Why Converting YouTube Video Into an Infographic Works So Well?
Gemini’s advantage comes from how it processes YouTube videos.
Most AI tools rely only on transcripts. If something appears visually in the video but isn’t spoken aloud, like formulas, labels, charts, or slide text, and they miss it.
Gemini reads the video frames directly. That means:
You get a richer summary because the model isn’t blind to visual content.
Why Gemini (and specifically Gemini 3 Pro) can do this differently?
If you want to know exactly about how to turn any youtube video into an infographic online, Gemini is one of the best LLM for this. Let’s know why choose Gemini:
What are the Pro Tips for Stronger Results?
A few small adjustments can noticeably improve the quality:
1. Let the model choose a style when unsure
It often produces better layouts when you allow it to decide between minimalist, sketch, poster-style, or corporate formats.
2. Ask for multiple slides for long videos
For anything over 20 minutes, tell it:
“Create one infographic per major section.”
This keeps each visual readable.
3. Double-check numbers and text
AI image text is much better than before, but occasionally a word or number may render incorrectly. A quick scan fixes this.
4. Use AI Studio for the final image
Gemini’s Ai Studio tends to produce clearer, watermark-free 4K images compared to the basic web chat interface.
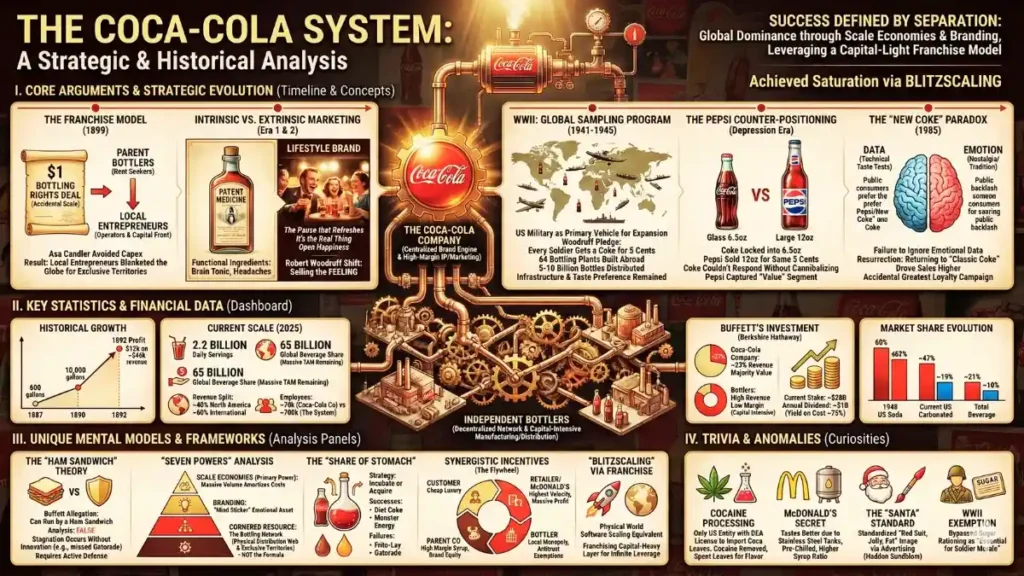
A Real-World Example
The Reddit user who shared this workflow used it on a four-hour Acquired Podcast episode about Coca-Cola. Instead of spending an entire afternoon listening, they generated a detailed infographic capturing the brand’s history, business strategy shifts, and major turning points.
What would normally be a several-hour time investment became a concise one-page visual.
Who Benefits Most From Turning YT Video into an Infographic?
This workflow is ideal for how to turn any youtube video into an infographic online:
If you’re someone who remembers concepts better when you can see them laid out visually, this is a productivity boost you’ll feel immediately.
Things to Keep in Mind
A few practical notes:
A quick human pass keeps things accurate.
Final Thoughts
YouTube is one of the best places to learn, but not everyone has the time or patience to sit through hours of content. This 2-step method turns lengthy videos into fast, digestible visual sheets that you can review anytime.
It’s simple, efficient, and surprisingly powerful. If your Watch Later list is overflowing, this might be the tool that finally helps you get through it.
FAQs:
Q. Can AI really “watch” a YouTube video and summarize it accurately?
Yes. Modern multimodal models like Gemini can read the transcript, analyze visuals, detect text on screen, and follow diagrams or charts. It isn’t perfect, but for educational content, it usually produces a clear and surprisingly detailed breakdown.
Q. Will the infographic be accurate enough for studying or work?
For most topics—business breakdowns, tutorials, lectures, and explainers—the results are solid. You should still skim the timestamps or key facts afterward, especially if the information is technical or you’ll be sharing it professionally.
Q. Do I need a paid plan to convert videos into infographics?
The method works best with the advanced versions of Gemini, which may require a subscription. Free plans can still analyze videos, but the accuracy, resolution, and image quality may vary.
Q. Are there copyright issues when sharing the infographic online?
You can create infographics for personal use without any concerns. If you plan to post them publicly, include the video link and credit the creator. Avoid using screenshots or large chunks of their original material unless you have permission.
Q. What makes Gemini better at analyzing YouTube videos than other AI models?
Gemini doesn’t rely only on the transcript. It can read text on screen, interpret charts, follow slides, and understand what’s happening visually. This gives it an edge when the video includes formulas, diagrams, or step-by-step demos that aren’t spoken aloud.
Q. Can Gemini actually process the full video, or does it just use the captions?
Gemini can process the video frames and audio directly when you give it a YouTube link. It pulls context from visuals, sound, and spoken content together, which is why its summaries feel more complete than transcript-based tools.
Q. Do I need Gemini Advanced to generate high-quality infographics?
You can create basic infographic summaries with the regular model, but Gemini Advanced (especially the image-capable version) produces cleaner layouts, better text clarity, and higher resolution graphics. Most users notice a clear jump in quality.
Q. Can Gemini generate multiple infographic slides for long videos?
Yes. If you ask it to split the content into sections, Gemini can produce separate infographic pages—one per topic. This is helpful for long lectures, podcasts, and multi-part tutorials that cover several deep concepts.
Q. How accurate is Gemini when pulling statistics or formulas from a video?
It’s good, but not flawless. Gemini often reads on-screen numbers correctly, but occasionally a digit or word may distort when rendered inside an image. A quick scan of the infographic text is usually enough to catch any small mistakes.


Comments are closed.